Learning Objective
By the end of this lesson, you will be able to explain what an ECG tracing records, describe why both ECG and EKG are correct names for the same test, and identify the main waveform parts in one normal heartbeat.
Opening Hook
If you have ever looked at an EKG tracing before, or glanced at a bedside monitor in the hospital, you have probably seen a repeating line with sharp spikes. It is easy to mistake that line for blood flow, blood pressure, or the heart squeezing. It is not. The tracing shows the heart’s electrical activity, the signal that coordinates pumping blood through the body. This first lesson gives you the basic frame you need: what the test is called, why it became such an important tool, and what the tracing actually represents.
What To Notice First
Notice the simplest idea before anything else: an ECG is a graph of electrical activity over time. This electrical activity represents the repeating activation and recovery that drives the heart’s cycle of contraction and relaxation, which you will study in more detail later. It is not a picture of the heart squeezing. It is not a direct readout of circulation. That one distinction keeps you from making one of the most common beginner mistakes when you start reading strips.
Why Both ECG and EKG Are Correct
ECG and EKG refer to the same test. ECG comes from the English word electrocardiogram. EKG reflects the older German spelling Elektrokardiogramm, which stayed common because early electrocardiography developed in an era when German-language scientific writing carried major influence.
You will see both abbreviations in monitors, charting, textbooks, and everyday clinical conversation. The abbreviation changes nothing about the test itself. In either form, you are talking about a recording of the heart’s electrical activity from electrodes on the skin.
How the ECG Became a Practical Clinical Tool
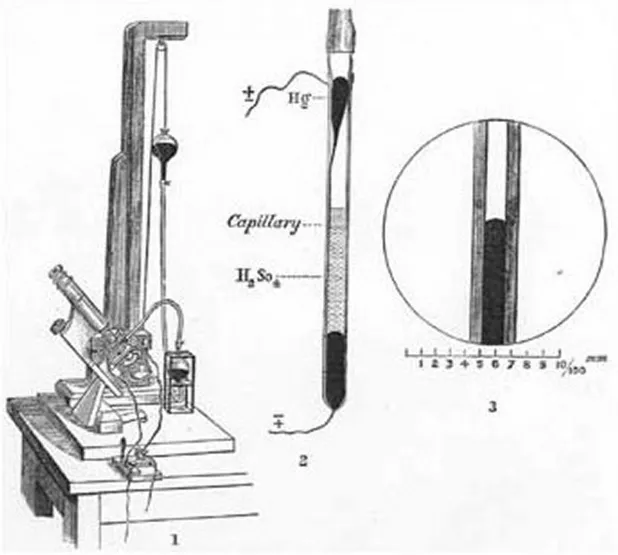
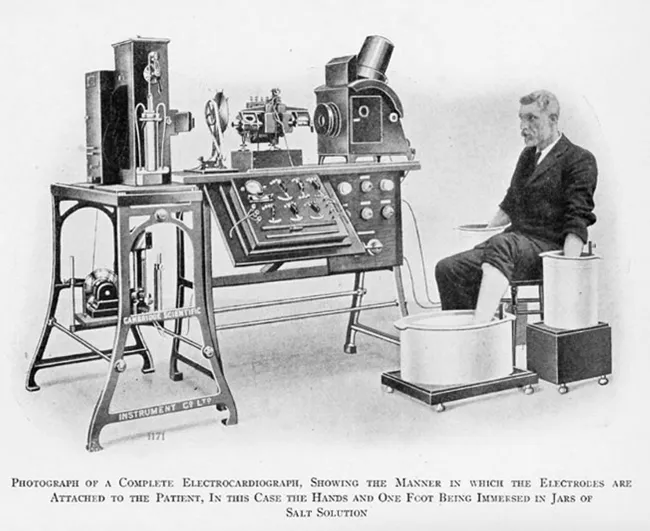
The ECG became useful when clinicians could finally record the heart’s tiny electrical signals accurately from the body surface. Early investigators showed that the heart generated measurable electrical activity, but the equipment was too limited for reliable bedside use. Willem Einthoven’s major breakthrough was the string galvanometer, introduced in the early 1900s, which was sensitive enough to turn those weak signals into clinically usable tracings.
Einthoven also helped stabilize the language that clinicians still use now. The waveform labels P, Q, R, S, and T are not modern shorthand. They come from the early standardization of electrocardiography and remain the shared vocabulary for describing what you see on a strip.
From there, the technology kept shrinking and spreading. What started as a room-sized instrument evolved into portable machines, telemetry systems, Holter monitors, and the bedside displays you see now.
What the Tracing Represents and What It Does Not
An ECG is a graph of voltage over time. The horizontal direction represents time. The vertical direction represents electrical amplitude. The machine detects very small electrical changes at the skin surface and plots them as the heart depolarizes and repolarizes.
Depolarization means heart cells are becoming electrically active and starting the process that leads to contraction. Repolarization means those cells are resetting electrically so they can fire again. The tracing reflects that electrical sequence, not the mechanical squeeze itself.
That is why an organized ECG does not guarantee effective circulation. A patient can have visible electrical activity on the screen and still have no useful pulse. The strip matters, but the patient always matters more.
How One Beat Becomes a Named Pattern
Once you know the tracing is electrical, the next step is learning the basic parts of one heartbeat.
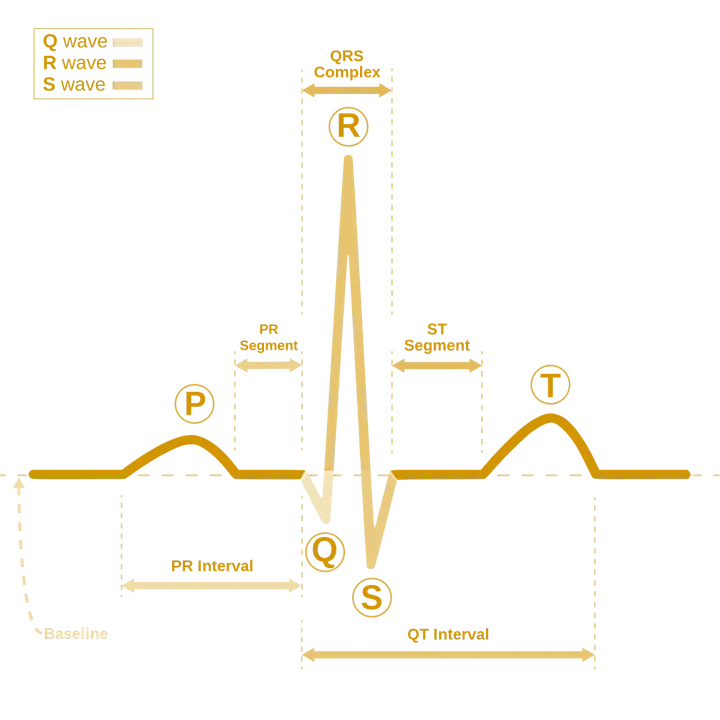
- P wave: atrial depolarization, meaning the atria are electrically activated.
- PR interval: the travel time from the start of atrial activation to the start of ventricular activation, including the normal delay through the atrioventricular node.
- QRS complex: ventricular depolarization, meaning the ventricles are electrically activated.
- ST segment: the early flat portion after ventricular depolarization.
- T wave: ventricular repolarization, meaning the ventricles are resetting electrically.
- QT interval: the total ventricular electrical cycle from the start of ventricular depolarization to the end of ventricular repolarization.
You do not need to master all measurements yet. For this lesson, the bigger goal is recognizing that the tracing follows a repeatable order. Atrial activity comes first, ventricular activation follows, and ventricular recovery comes after that.
Worked Example: Reading One Normal Electrical Cycle
Look at the labeled strip as one organized electrical cycle.
Start with the order, not the measurements. You see a small P wave, then a QRS complex, then a T wave. That tells you the atria activate before the ventricles, and the ventricles repolarize afterward.
Next, notice why the QRS stands out. The ventricles have much more muscle mass than the atria, so ventricular depolarization usually creates the largest visible deflection on the tracing.
Finally, notice what the labeled intervals are doing for you. The PR interval tracks how long the impulse takes to move from atrial activation into the ventricles. The QT interval spans the full ventricular electrical cycle. You will measure those precisely later, but you should already know what they refer to.
Why Lead Perspective Matters Even in an Intro Lesson
The same heartbeat can look different depending on the lead, which is the electrical viewpoint used to observe it. A wave moving toward a lead often creates an upward deflection. A wave moving away often creates a downward deflection. A wave moving mostly across that lead’s line of view may create a smaller or mixed deflection.
You do not need full lead analysis yet. You do need this beginner rule: a change in waveform shape does not automatically mean a different rhythm. Sometimes it only means you are looking from a different angle.
Don’t Confuse This With
- An echocardiogram: Both are heart tests, so they are easy to blur together. The best distinguishing clue is that an ECG records electrical activity, while an echocardiogram uses ultrasound to show anatomy and motion.
- A pulse oximeter waveform: Both are repeating bedside waveforms. The best distinguishing clue is that a pulse ox waveform reflects pulsatile blood flow, while an ECG tracing shows electrical events such as P waves and QRS complexes.
- A telemetry rhythm strip and a full 12-lead ECG: Both record cardiac electrical activity. The best distinguishing clue is that a rhythm strip is a limited monitoring view, while a 12-lead ECG records multiple simultaneous perspectives.
Lesson Summary
- ECG and EKG are two accepted abbreviations for the same test, and the difference is historical rather than clinical.
- The ECG became clinically useful when accurate surface recording of the heart’s tiny electrical signals became possible, especially after Einthoven’s string galvanometer and waveform standardization work.
- An ECG is a graph of voltage over time, so it records electrical activity rather than direct mechanical pumping.
- The main named parts of one normal heartbeat are the P wave, PR interval, QRS complex, ST segment, T wave, and QT interval.
- Lead perspective affects waveform appearance, so the same heartbeat can look different from one viewpoint to another without becoming a different rhythm.
- The bedside safety rule is simple: you interpret the tracing and the patient together, because electrical activity alone does not prove effective circulation.
What’s Next
The next lesson moves from the tracing to the structures that create it: heart anatomy, blood flow, and the electrical conduction system. You will connect the terms you learned here to the chambers, valves, and pathways that generate the waveform.