The ECG Rhythms content is currently under development and is being updated by medical professionals.
The Symphony of the Heart: An Introduction to Electrocardiograms
The electrocardiogram (ECG) serves as a visual representation of the heart’s electrical activity, capturing the intricate patterns of depolarization and repolarization that occur during each cardiac cycle. This non-invasive diagnostic tool plays a pivotal role in cardiology, providing invaluable information about the heart’s function and structure. The ECG machine, connected to the body via electrodes, detects the minute electrical potentials generated by the heart muscle. These signals are then amplified and displayed as waveforms on a moving graph, allowing healthcare professionals to interpret the heart’s rhythm and identify any abnormalities. The term “lead” in electrocardiography refers to the specific view of the heart’s electrical activity obtained by the placement of electrodes in particular configurations. Fundamentally, an ECG is a graph plotting voltage against time, illustrating the heart’s electrical behavior. This technology allows for the recognition and recording of the heart’s electrical impulses, offering insights into the health and potential diseases of this vital organ. The ECG procedure is generally simple, quick, and painless, making it a cornerstone of cardiac assessment.
A Historical Overture
The journey to the modern electrocardiogram began in the late 18th century with initial observations of electrical activity in living tissues. Luigi Galvani, an Italian physician, first noted in the 1780s that electrical current could be recorded from skeletal muscles. In the late 19th century, significant advancements were made, including the invention of the capillary electrometer by Gabriel Lippmann, a device capable of measuring small voltage changes on the body’s surface produced by the heart’s activity. Building on this, in 1887, Augustus Waller successfully recorded the first human electrocardiogram using Lippmann’s electrometer. However, these early recordings were limited by the technology of the time. The pivotal figure in the history of electrocardiography is Willem Einthoven, a Dutch physician and physiologist. Recognizing the potential of recording the heart’s electrical activity as a diagnostic tool, Einthoven significantly improved upon existing methods. Around the turn of the 20th century, he invented the first practical electrocardiograph, the string galvanometer, around 1901-1903. This device was far more sensitive and reliable than previous instruments. Einthoven also coined the term “electrocardiogram”, standardized the ECG recording process, and introduced the triaxial bipolar limb lead system. For his groundbreaking work, Einthoven was awarded the Nobel Prize in Physiology or Medicine in 1924.
The 12 Leads: A Chorus of Perspectives
A standard 12-lead ECG provides a comprehensive view of the heart’s electrical activity by recording signals from ten electrodes placed on the body. These electrodes are strategically positioned on the limbs and chest to capture the heart’s electrical signals from different angles in three dimensions. The 12 leads are categorized into limb leads and precordial (chest) leads. The limb leads consist of three bipolar leads (I, II, III) that measure the potential difference between two limbs, and three augmented unipolar leads (aVR, aVL, aVF) that record the electrical potential from one limb relative to a central reference point. The three bipolar limb leads (I, II, and III) form the basis of Einthoven’s triangle, an imaginary equilateral triangle with the heart at its center, connecting the right arm, left arm, and left leg. Einthoven’s Law (Lead II = Lead I + Lead III) describes the mathematical relationship between these leads. The precordial leads (V1-V6) are six unipolar leads placed directly on the chest, providing a view of the heart’s electrical activity in the horizontal plane.
Decoding the Rhythm: Waves and Intervals
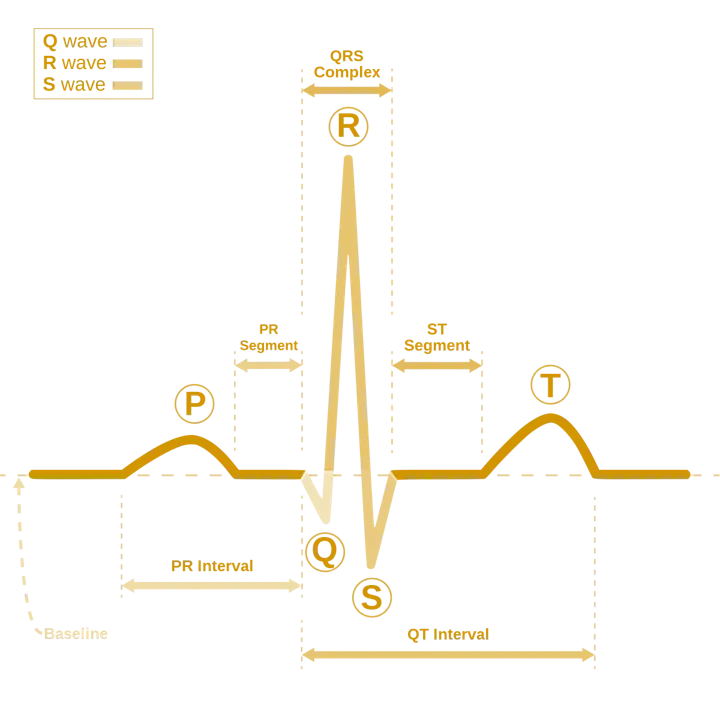
The ECG tracing is characterized by distinct waveforms and intervals that correspond to specific electrical events in the heart during a cardiac cycle. The P wave represents the depolarization (electrical activation) of the atria, which precedes atrial contraction. Following the P wave is the PR interval, which reflects the time taken for the electrical impulse to travel from the atria through the atrioventricular (AV) node to the ventricles. The QRS complex represents the depolarization of the ventricles, initiating ventricular contraction. The duration of the QRS complex indicates the time taken for ventricular depolarization. The ST segment represents the period between ventricular depolarization and repolarization. The T wave signifies the repolarization (electrical recovery) of the ventricles. Occasionally, a U wave may be visible after the T wave, thought to represent repolarization of the Purkinje fibers. The QT interval measures the total duration of ventricular depolarization and repolarization. The RR interval represents the time between two consecutive ventricular depolarizations (heartbeats), and the PP interval represents the time between two consecutive atrial depolarizations.

The Importance of Rate and Rhythm
Heart rate and rhythm are fundamental aspects of ECG interpretation and provide immediate insights into the heart’s overall function. The heart rate, typically measured in beats per minute (bpm), reflects the frequency of cardiac cycles. For adults, a normal resting heart rate generally falls between 60 and 100 bpm, though this can vary with age and physical condition, with children typically having higher normal heart rates. The rhythm refers to the pattern of heartbeats, which should ideally be regular when the heart’s electrical impulses originate from the sinoatrial (SA) node. Several methods exist for calculating heart rate from an ECG tracing, including the large square method (300 divided by the number of large squares between consecutive R waves), the small square method (1500 divided by the number of small squares between consecutive R waves), and the 6-second method (counting the number of QRS complexes in a 6-second strip and multiplying by 10). Assessing the heart rate and rhythm is the initial and crucial step in the systematic interpretation of any ECG.
Table 1: Normal ECG Values
| Parameter | Normal Range |
|---|---|
| P wave duration | 0.08-0.10 seconds |
| PR interval | 0.12-0.20 seconds |
| QRS duration | 0.06-0.10 seconds |
| QT interval | 0.35-0.43 seconds (varies with heart rate) |
| RR interval | Varies with heart rate |